
Every data automation team eventually builds an alerting system, and almost every one of them follows the same trajectory. It starts strict: alert on every failure, every retry, every anomaly. Within a few months, the on-call channel is a wall of noise, most of it self-resolving retries and expected edge cases, and the team has quietly started ignoring it. Then a genuinely serious failure shows up dressed exactly like the noise, and nobody notices for six hours.
This isn't a tooling problem. You can run the same alerting stack well or badly. The difference is almost entirely in how deliberately the alerting strategy was designed, and most teams never actually design one, they just accumulate alerts one incident at a time until the whole thing collapses under its own volume.
Why Alert Fatigue Happens So Predictably

Photo by Samon Yu on Pexels
The pattern behind alert fatigue is well documented outside of software too, it's the same phenomenon behind hospital monitoring systems and industrial control rooms. When the signal-to-noise ratio of an alert channel drops low enough, humans stop treating individual alerts as meaningful and start treating the whole channel as background noise. Once that shift happens, it's genuinely difficult to reverse, because rebuilding trust in an alert channel takes much longer than losing it did.
For data automation specifically, the usual culprits are predictable: alerting on every job retry instead of only exhausted retries, alerting on transient upstream API errors that a circuit breaker already handles gracefully, and alerting on data volume fluctuations that are normal weekend or holiday variance rather than genuine anomalies.
Start With a Severity Model, Not a Tool
Before touching any alerting configuration, define what actually constitutes each severity level for your specific pipelines. A useful starting split:
- Page immediately. Data loss, a pipeline that's stopped entirely, or a downstream system now receiving corrupted records. Someone needs to act right now, day or night.
- Notify during business hours. A job that failed but has healthy retry logic and hasn't exhausted its attempts, or a data quality check that flagged a borderline anomaly worth a human look.
- Log only, review in aggregate. Individual transient errors, single-record validation failures, anything the system already handled correctly on its own.
Most teams skip this exercise and let every failure default to the loudest channel, which is exactly how alert fatigue starts. Writing this severity model down, even informally, forces the team to actually decide what's worth waking someone up for instead of defaulting to "everything, just in case."
Alert on Symptoms, Not Causes

Photo by Sueda Gln on Pexels
A pipeline can fail for dozens of underlying reasons, a flaky upstream API, a schema change, a network blip, a resource limit. Alerting on every possible cause individually creates a maintenance burden that grows every time a new failure mode is discovered. Alerting on symptoms, "this pipeline hasn't successfully completed in X hours" or "downstream table Y hasn't been updated in Z hours", catches the same underlying problems with far fewer, more durable alert rules.
This approach also survives changes to the pipeline's internals. If you rewrite how a job handles retries next quarter, a symptom-based alert ("data freshness exceeded threshold") doesn't need to change. A cause-based alert tied to specific retry logic almost certainly would.
Build In Deduplication and Grouping From the Start
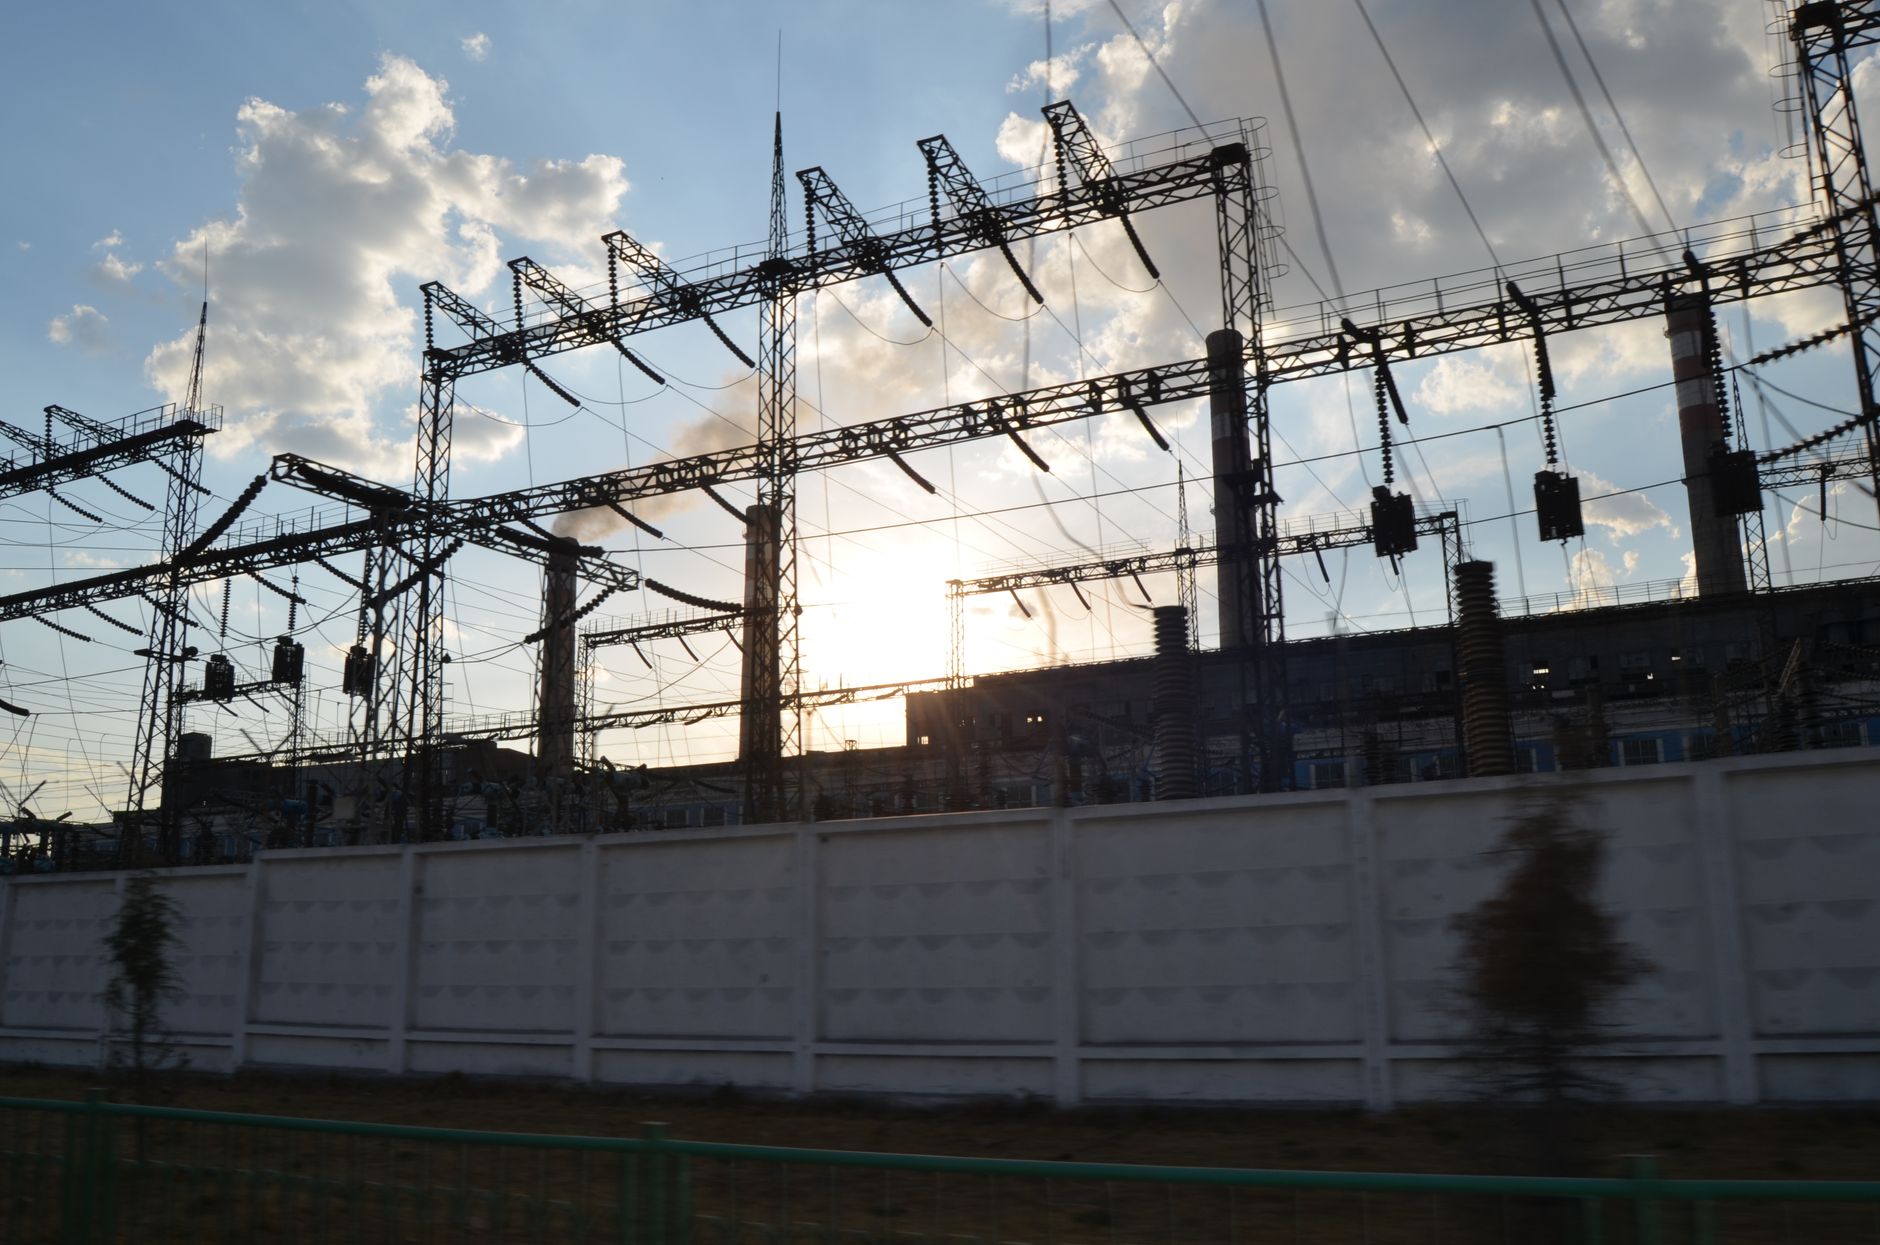
Photo by Daryana Vasson on Pexels
A single upstream outage can trigger dozens of individual job failures across a pipeline within minutes. Without grouping, that's dozens of separate pages for what is, from a human's perspective, one incident. Most modern alerting and incident management platforms, including PagerDuty, support event grouping and deduplication rules specifically for this scenario, and setting them up early prevents the exact kind of alert storm that teaches people to mute the channel.
Set Explicit Thresholds for "Anomaly" Rather Than Eyeballing It
Vague thresholds like "alert if volume looks unusual" inevitably drift toward either too sensitive or too lax, depending on who tuned it last and what incident was fresh in their mind. Defining an explicit statistical threshold, a percentage deviation from a rolling baseline, or a fixed absolute floor for expected minimum records, gives the team something concrete to adjust deliberately rather than something that quietly degrades over time as different people nudge it in different directions.
"The alerting systems that actually get trusted are the boring ones, tight severity definitions, symptom-based triggers, and someone reviewing false positives every sprint. The moment you stop pruning bad alerts, the whole system starts decaying." - Dennis Traina, founder of 137Foundry
Every Alert Needs a Runbook, Not Just a Trigger
An alert that fires with no guidance on what to do next just transfers the confusion from the system to a human at the worst possible time, usually 2 a.m. Pairing every page-level alert with a short runbook, even a few bullet points covering "check this dashboard first, here's the most common cause, here's who to escalate to if it's not that", cuts response time dramatically and reduces the chance that an on-call engineer makes the problem worse by guessing under pressure.
This doesn't need to be exhaustive documentation. A runbook that covers the three most common causes of a given alert, with links to the relevant dashboards and logs, handles the overwhelming majority of real incidents. Rare, novel failures will always require genuine investigation, but those are a small fraction of total pages if the alerting strategy above is working as intended.
Test Alerts Before You Need Them For Real
It's common to discover that an alert never actually fires the way it was intended, wrong threshold, wrong field name after a schema change, notification routed to a channel nobody watches, only during a real incident, which is the worst possible time to find out. Periodically triggering a known, controlled failure and confirming the expected alert fires, routes correctly, and reaches the right people is a cheap way to catch this kind of silent breakage before it costs you during an actual outage.
This is especially worth doing after any change to the underlying pipeline architecture, a new orchestration tool, a migrated data warehouse, a new alerting platform, since it's exactly the kind of change that quietly breaks alert wiring without anyone noticing until the next incident.
A Worked Example: Catching a Silent Schema Drift
Consider a pipeline that ingests vendor data daily and loads it into a reporting table. A cause-based alert might watch for "API request failed", which says nothing if the vendor's API starts silently dropping a field instead of erroring out. A symptom-based alert watching "expected column X is null in more than 5% of today's rows" catches the actual downstream problem regardless of whether the root cause was a vendor schema change, a parsing bug, or a mapping error introduced in a recent deploy. That's the practical payoff of designing around symptoms: it catches failure modes nobody anticipated when the alert was written.
Review False Positives on a Schedule, Not Just After Incidents
The single highest-leverage habit for keeping an alerting system trustworthy is a recurring review of every alert that fired and turned out not to matter. Without this review built into a regular cadence, false positives accumulate silently until the channel is noisy again, and the team only notices once trust has already eroded. A 15 minute review during a weekly team sync, going through the past week's alerts and asking "was this worth a page," catches drift early instead of after it's already caused someone to miss a real incident.
Observability Standards Worth Building Toward
Open standards like OpenTelemetry make it easier to instrument data automation jobs consistently, so that the same tracing and metrics conventions apply whether a job runs as a scheduled batch process, a streaming consumer, or an on-demand API trigger. Standardizing instrumentation early pays off specifically here, because a consistent tagging and severity taxonomy across every pipeline is what makes symptom-based, deduplicated alerting practical to maintain as the number of pipelines grows.
What Good Alerting Actually Looks Like Day to Day

Photo by Tima Miroshnichenko on Pexels
A well-designed alerting setup is, honestly, a little boring. Pages are rare and almost always warranted. Business-hours notifications are specific enough that whoever picks them up knows immediately what to check, rather than starting from "let me figure out what this even means." And the team has enough confidence in the signal that when something does page at 2 a.m., nobody's first reaction is to assume it's noise and go back to sleep.
Google's Site Reliability Engineering resources cover this philosophy in more depth, and the core idea generalizes cleanly to data automation even though it originated in service uptime monitoring: every alert should be actionable, every page should represent something a human genuinely needs to address, and anything that doesn't meet that bar belongs in a dashboard or a log, not an alert channel.
A Practical Starting Checklist
- Define severity tiers explicitly, in writing, before configuring any alert rules
- Prefer symptom-based alerts ("table hasn't updated") over cause-based ones tied to specific failure modes
- Group and deduplicate related alerts so one upstream outage doesn't generate dozens of individual pages
- Set explicit, documented thresholds for anomaly detection instead of vague, informally tuned ones
- Review false positives on a fixed weekly or biweekly cadence, not just reactively after a missed incident
- Standardize instrumentation across pipelines so alerting logic stays consistent as the system grows
Final Thoughts
Alert fatigue isn't a sign that a team doesn't care about reliability, it's usually a sign that alerting was never deliberately designed in the first place, just accumulated one incident at a time. The fix isn't more alerts or fewer alerts as a blanket rule, it's a genuine severity model, symptom-based triggers, and a habit of pruning false positives before they erode trust in the channel.
Getting this right takes real, ongoing discipline, not a one-time configuration pass. If your team's data pipelines are generating more noise than signal and you want a second opinion on the architecture, 137Foundry's data automation team has helped teams rebuild alerting strategies that people actually trust again, and can walk through what's specifically going wrong in yours. This kind of work often overlaps with broader data integration projects, since alerting design tends to surface upstream data quality issues that were previously invisible. You can also browse the rest of 137Foundry's service offerings or head back to the homepage for more on how we approach this kind of reliability work.